From idea to backtest in 3 clicks
Describe your strategy in plain English or write the expression yourself. ftInvstr handles the data, simulation, and full analytics — built on bias-safe Indian equity data going back 6+ years.
Strategy Lab — AI Mode
Type your idea in plain English, the AI writes the expression
The entry point
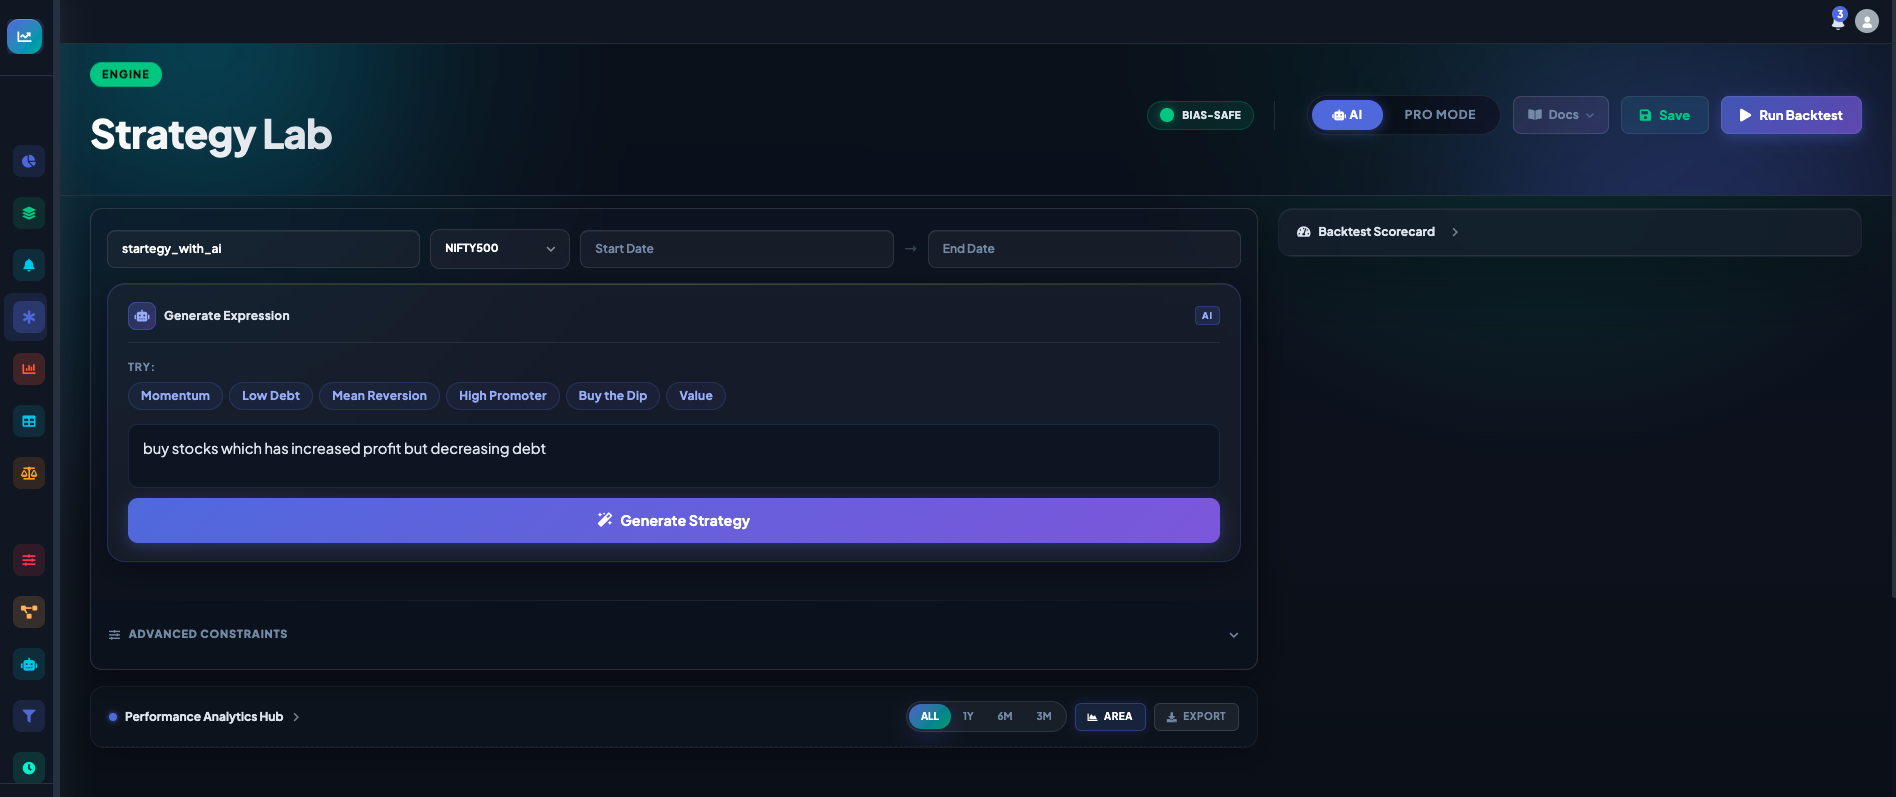
Strategy Lab opens in AI Mode by default. Give your strategy a name, pick a pre-built universe (NIFTY 50 / NIFTY 100 / NIFTY 500 / ALL), set the backtest dates, then either tap a TRY pill (Momentum, Low Debt, Mean Reversion, High Promoter, Buy the Dip, Value) or describe your idea in your own words.
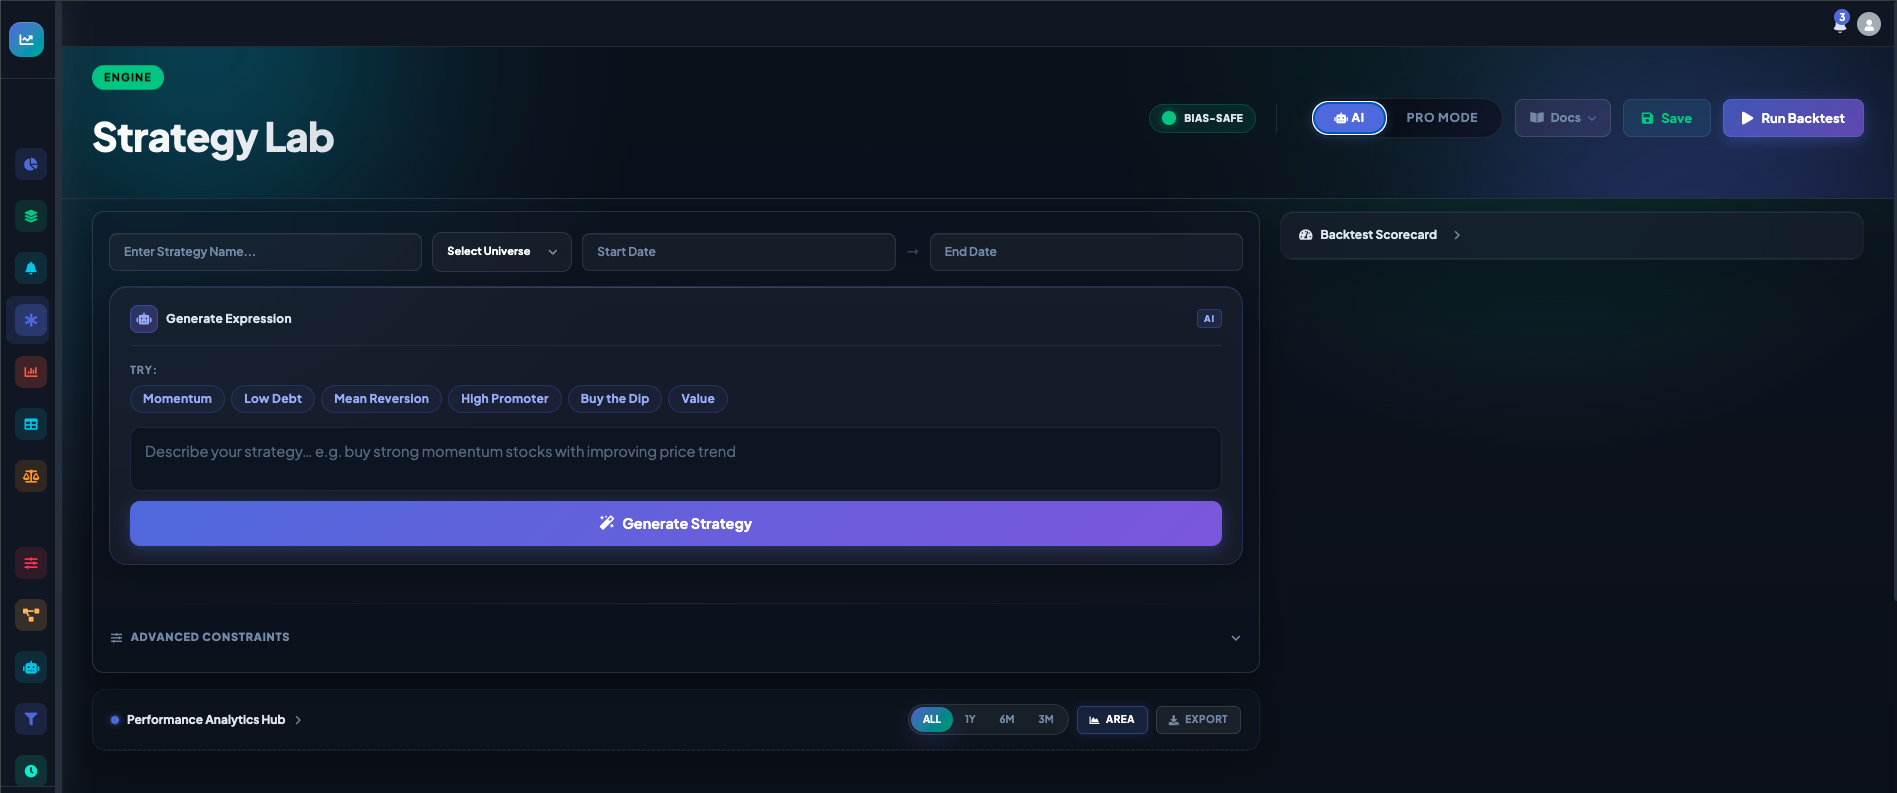
Describe what you want
Type your idea naturally. Examples that work:
- "buy stocks which have increased profit but decreasing debt"
- "momentum on close, top decile, monthly rebalance"
- "high promoter holding with low free cash flow yield"
AI returns a runnable expression
The AI translates your idea into a real, bias-safe ftInvstr expression you can run, save, or hand-edit. From the result panel you can immediately click Run Backtest, jump into Edit in Pro to refine, or restart with New Idea.
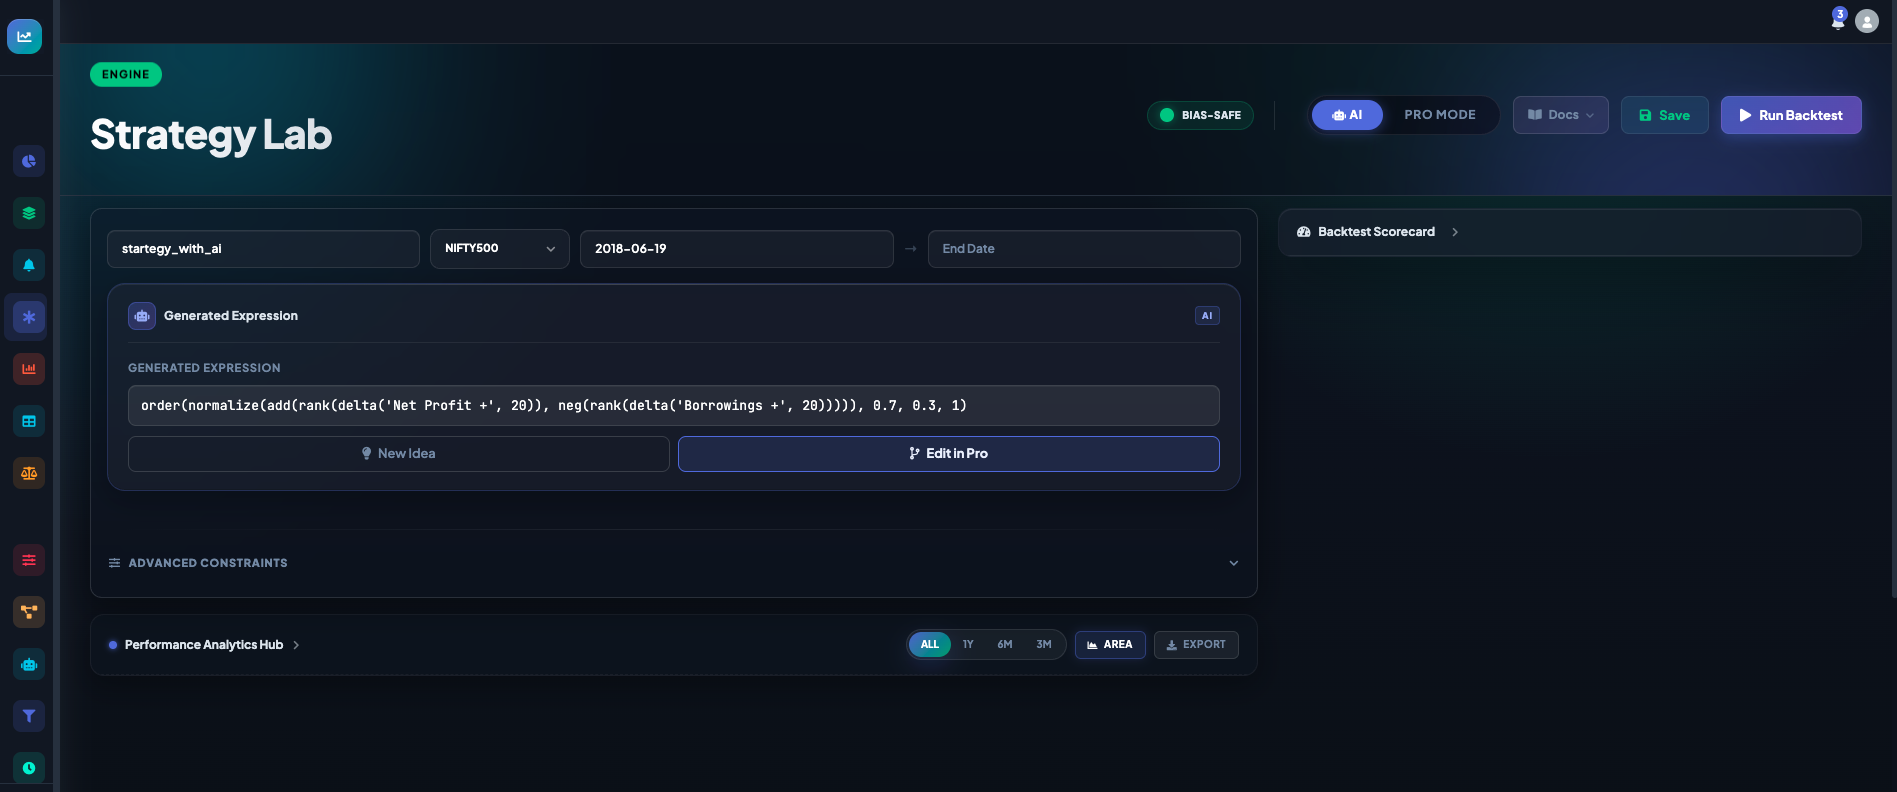
order(normalize(add(rank(delta('Net Profit +', 20)), neg(rank(delta('Borrowings +', 20))))), 0.7, 0.3, 1)
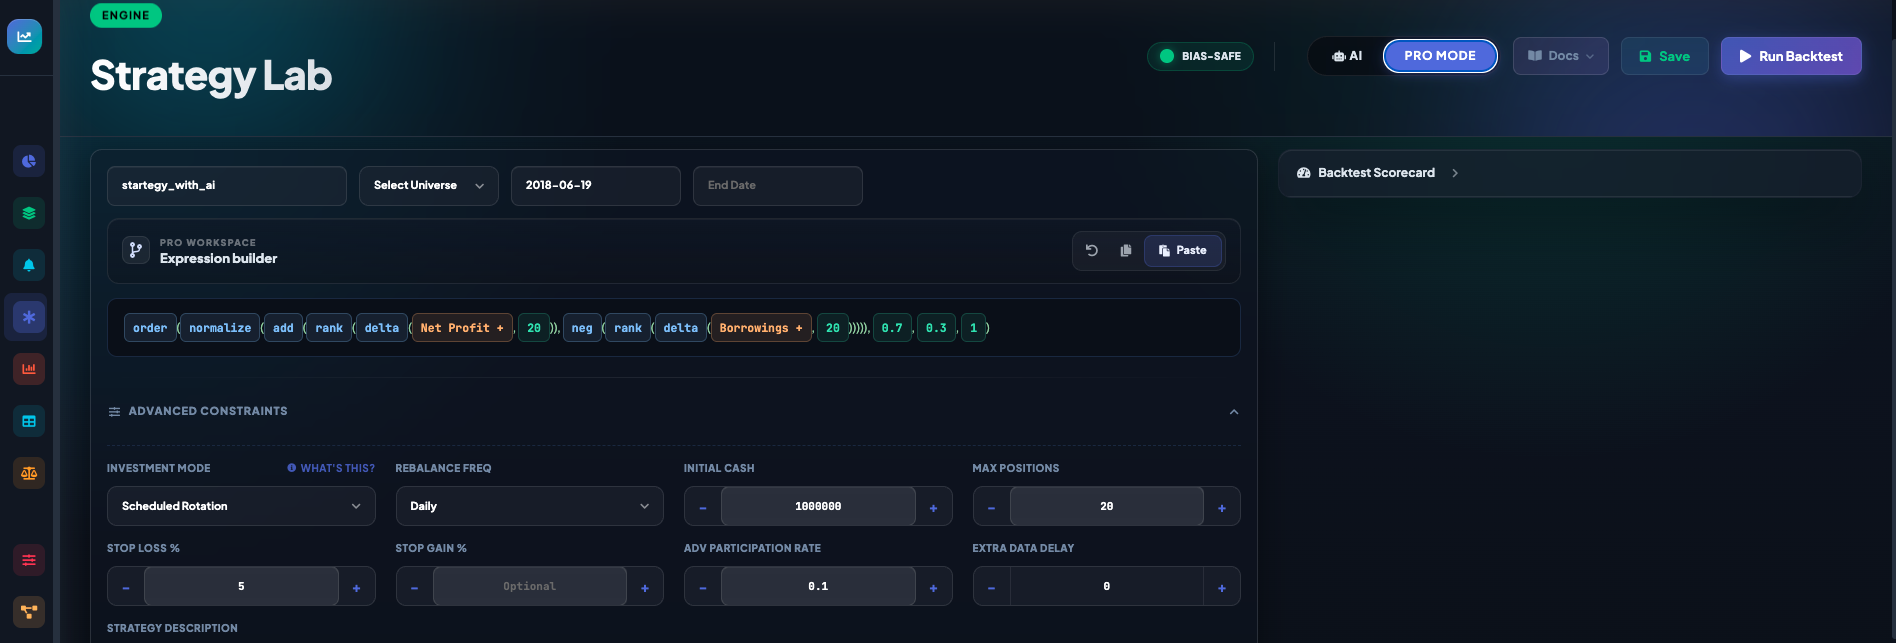
for "increased profit, decreasing debt".Tune the constraints
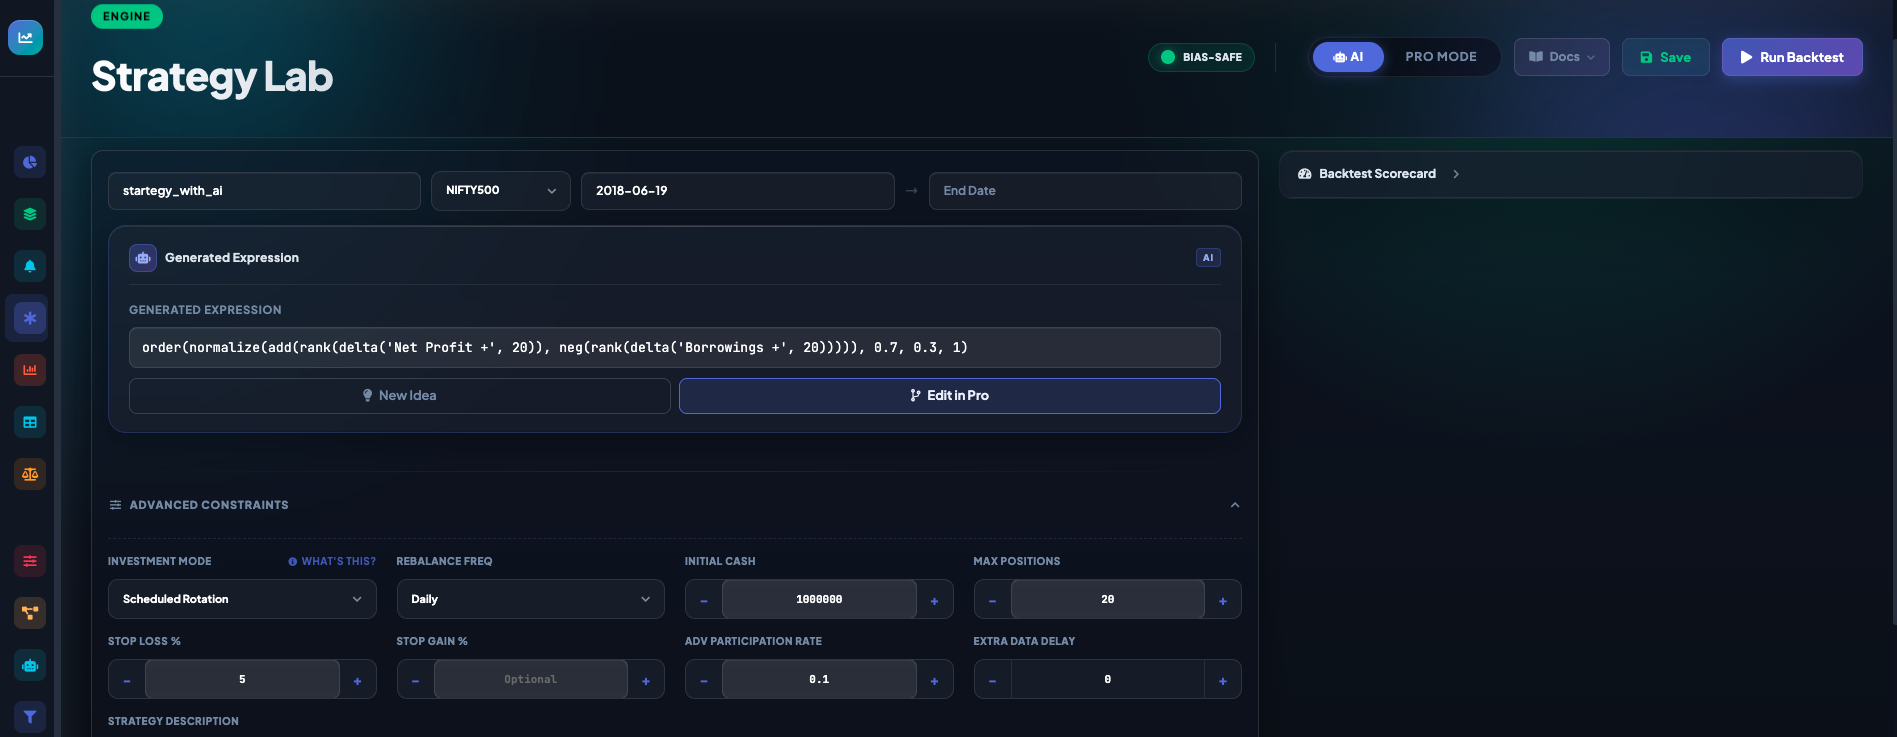
Open Advanced Constraints to control investment mode, rebalance frequency, initial capital, max positions, stop loss / stop gain, minimum participants, and brokerage rate. Sensible defaults are pre-filled from your last setup.
Strategy Lab — Pro Mode
Write the expression directly when you know what you want
Pro Workspace
Toggle Pro Mode to open the expression builder. The editor tokenises every function and field as a chip, so you can see the structure at a glance and paste expressions directly from this guide or from your own notes.
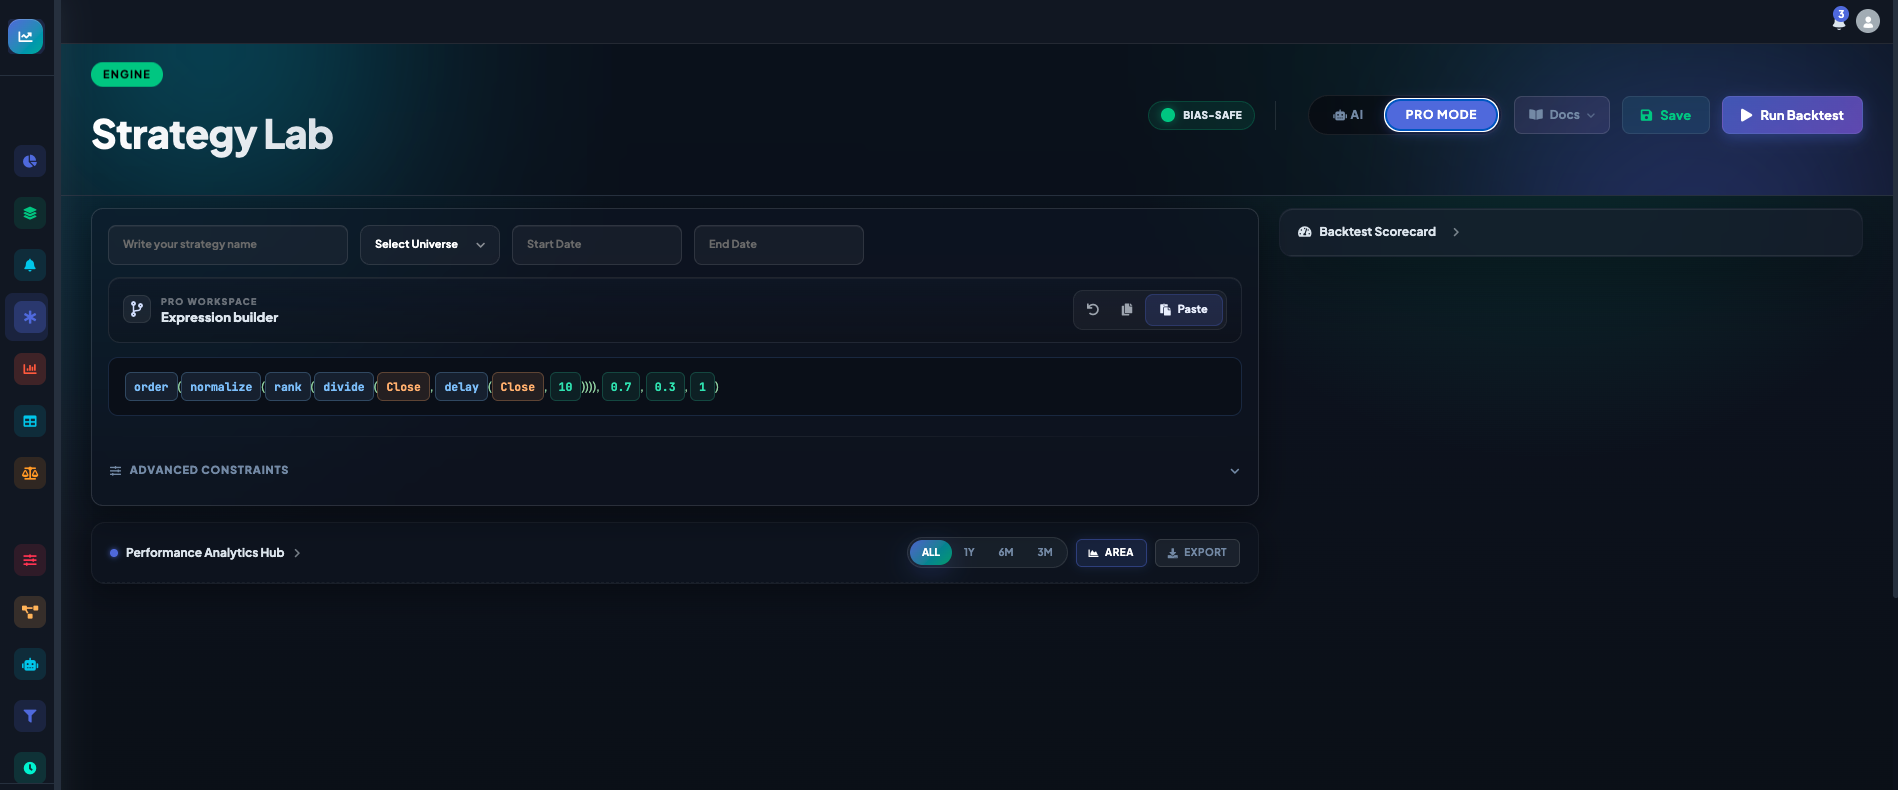
Same expression, full view
The expression from AI Mode opens cleanly in Pro Mode. You can edit individual tokens, add nested operators, and adjust Advanced Constraints all in one screen before clicking Run Backtest.
Pick a Stock Universe
Pre-built, bias-safe NSE universes — no setup required
Universe options
Every strategy runs against a fixed, date-stamped universe so a stock that was delisted on 2022-06-15 doesn't pollute a backtest on 2022-06-16. Pick from the dropdown:
Top 50 large caps
India's bluest-chip index. Conservative; best for foundational momentum / value studies.
Top 100 by market cap
Adds large-mid caps. Wider opportunity set than NIFTY 50 with similar liquidity.
Top 500 broad market
The most-used universe on ftInvstr. Covers ~95% of NSE market cap, includes mid & small caps.
Every listed NSE stock
The widest scope. Use when you want true cross-sectional ranking over the full market.
What Data Is Available
Three families of fields you can reference in any expression
Data families
OHLCV & market
From 2000 · Open, High, Low, Close, Adj Close, Volume per stock. Plus NIFTY 50 benchmark for relative-performance and beta computations.
XBRL filings, bias-safe
From 2018 · Quarterly P&L (Sales, EBIT, Net Profit), Balance Sheet
(Equity, Borrowings, Cash), Cash Flow (FCF, CFO), ratios, shareholding (Promoters, FIIs, DIIs). Every row is
gated by its filing's available_from_date — no look-ahead.
Forward-growth signals
From 2020 daily · 36 ML-predicted fields covering forward 1Y Sales /
EBIT / FCF growth, across 3 model regimes (stable_7y / rolling_4y / recent_2y) and 3 horizons (h1, h2, h3).
Use directly in DCF-style expressions:
predicted_growth_fcf_1y_rolling_4y_h1.
RBI, MOSPI, NSDL
Repo rate, 10Y G-Sec yield, CPI, IIP, GDP, FII/DII flows, NIFTY sectoral indices — all forward-filled daily. Browse the full catalog in Data Explain.
Investment Modes
How a signal becomes a position — the engine offers 8 different rules
The four most-used modes
Equal-Weight Top-N
Pick the top N stocks by score; allocate the same rupee amount to each. Simplest, most diversified.
Score-Weighted Top-N
Top N stocks, but allocation scales with score. Higher conviction → larger position.
Long / Short Top-N
Buy top N, short bottom N. Market-neutral exposure when the signal works both directions.
Sector-Neutral Top-N
Pick equal numbers of top stocks per sector. Removes sector tilt from the bet.
Other modes include beta-neutral, scheduled rotation, and regime-switching dynamic.
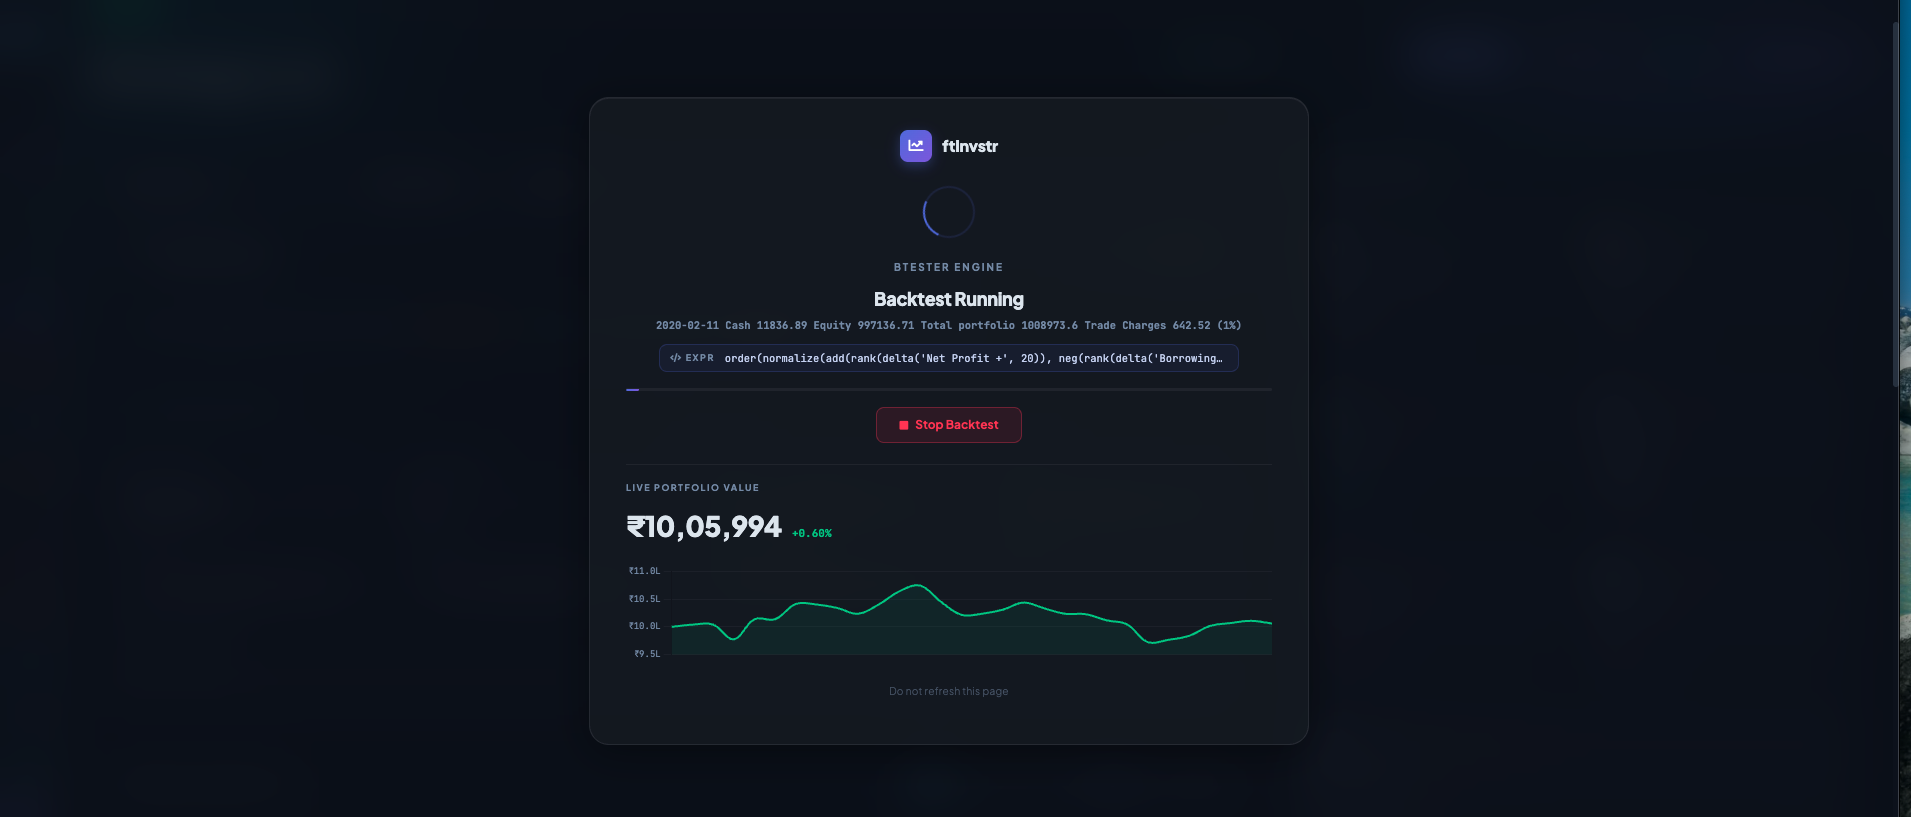
Read the full investment modes guideRun the Backtest
Watch the equity curve build live as the engine walks the calendar
Live simulation
The engine simulates trading day by day: loads the universe snapshot, evaluates your expression against bias-safe historical data, executes trades at the next day's open, deducts brokerage, and records portfolio value. You see the current date being processed, the live cash / equity, and the equity curve growing in real time. You can stop and inspect any time.
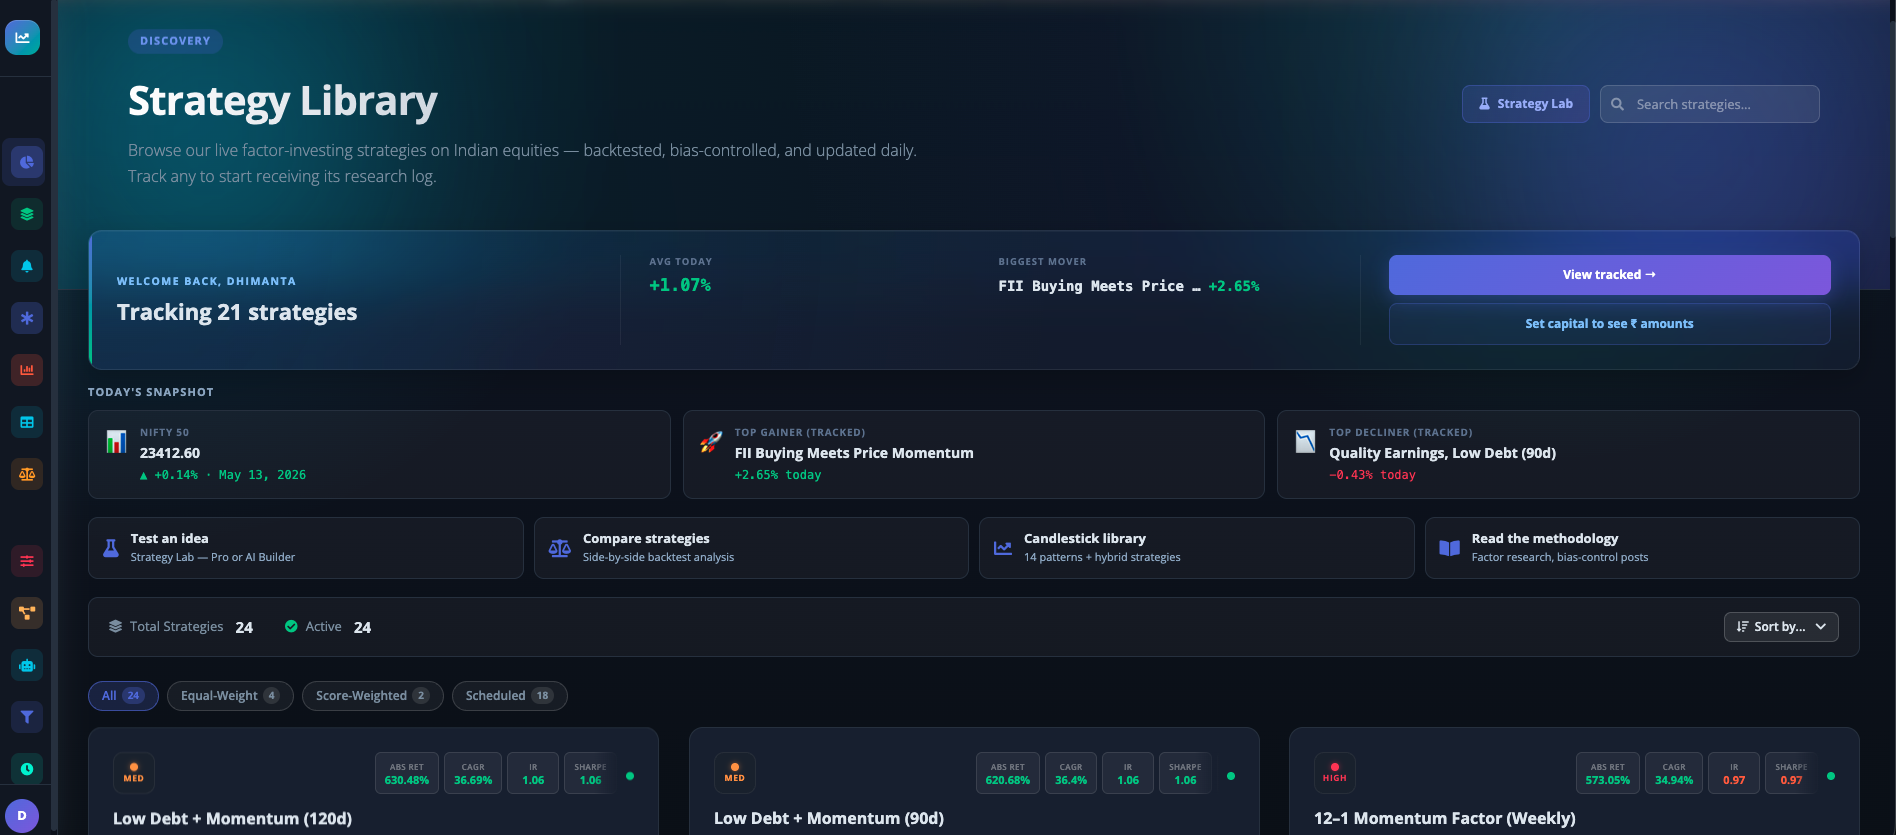
Strategy Library
Your saved strategies, organised and tracked
The Dashboard
Once you save a backtest, it lands in your Strategy Library. The dashboard shows your top-performing strategy today, a featured "Rising Star" from the platform, and quick-access tiles for testing ideas, comparing strategies, and the candlestick library. Each strategy card surfaces its CAGR, recent return, and tags.
Inside a Strategy
Every metric, chart, position, and rebalance — on a single page
Header — what this strategy does
The top of any strategy page summarises the thesis, the universe, the initial capital, and the headline metrics (CAGR, Sharpe, Sortino, Information Ratio, Max Drawdown). The chart underneath plots its equity curve from inception against the broader market.
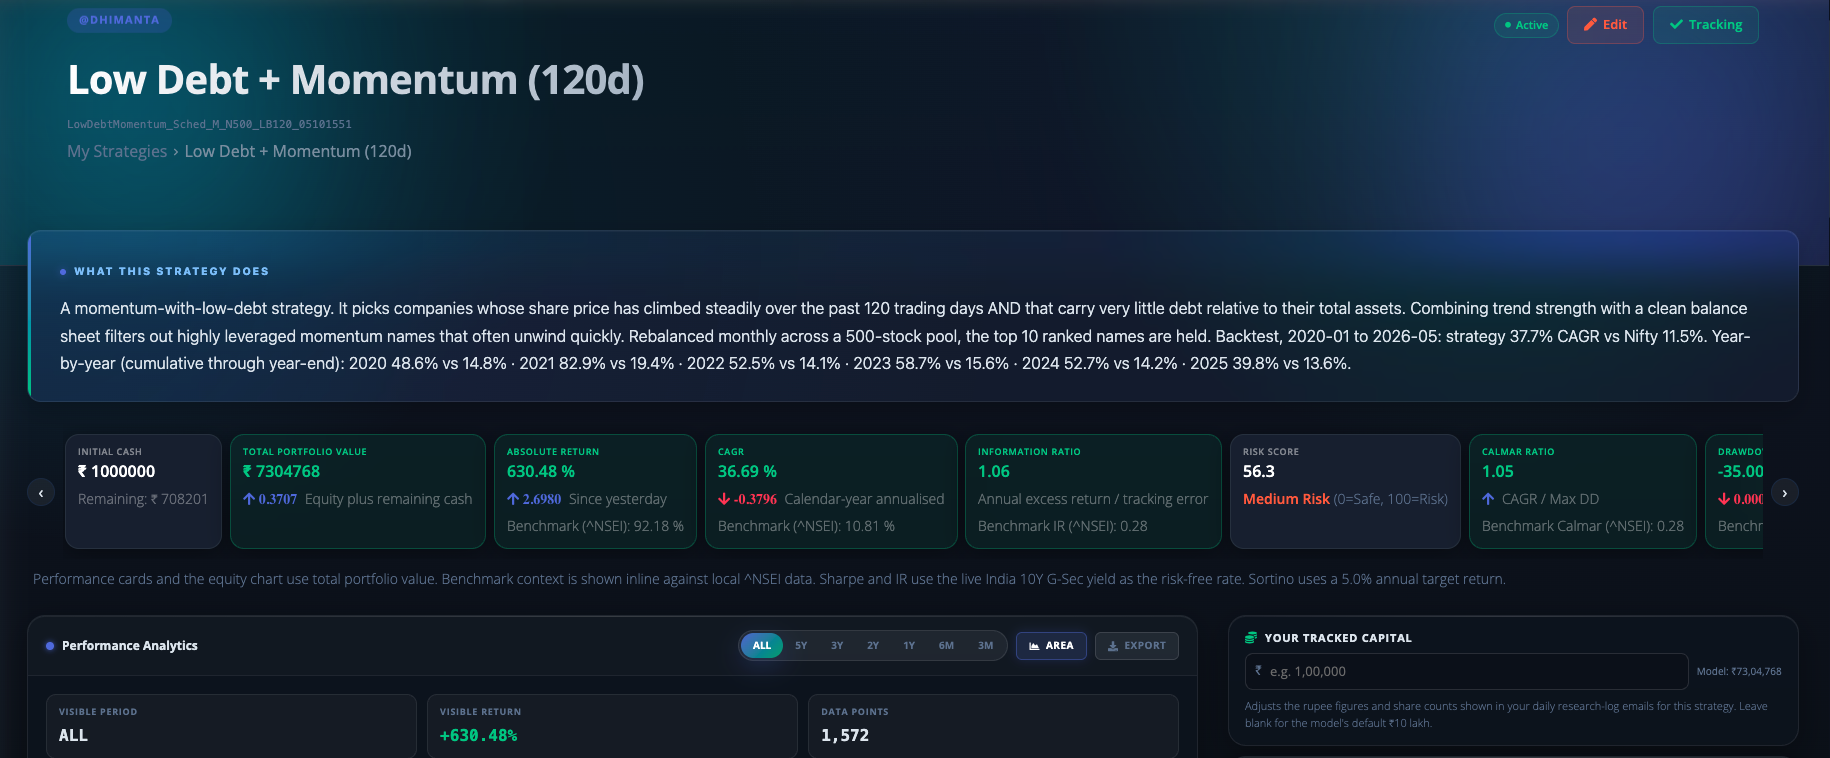
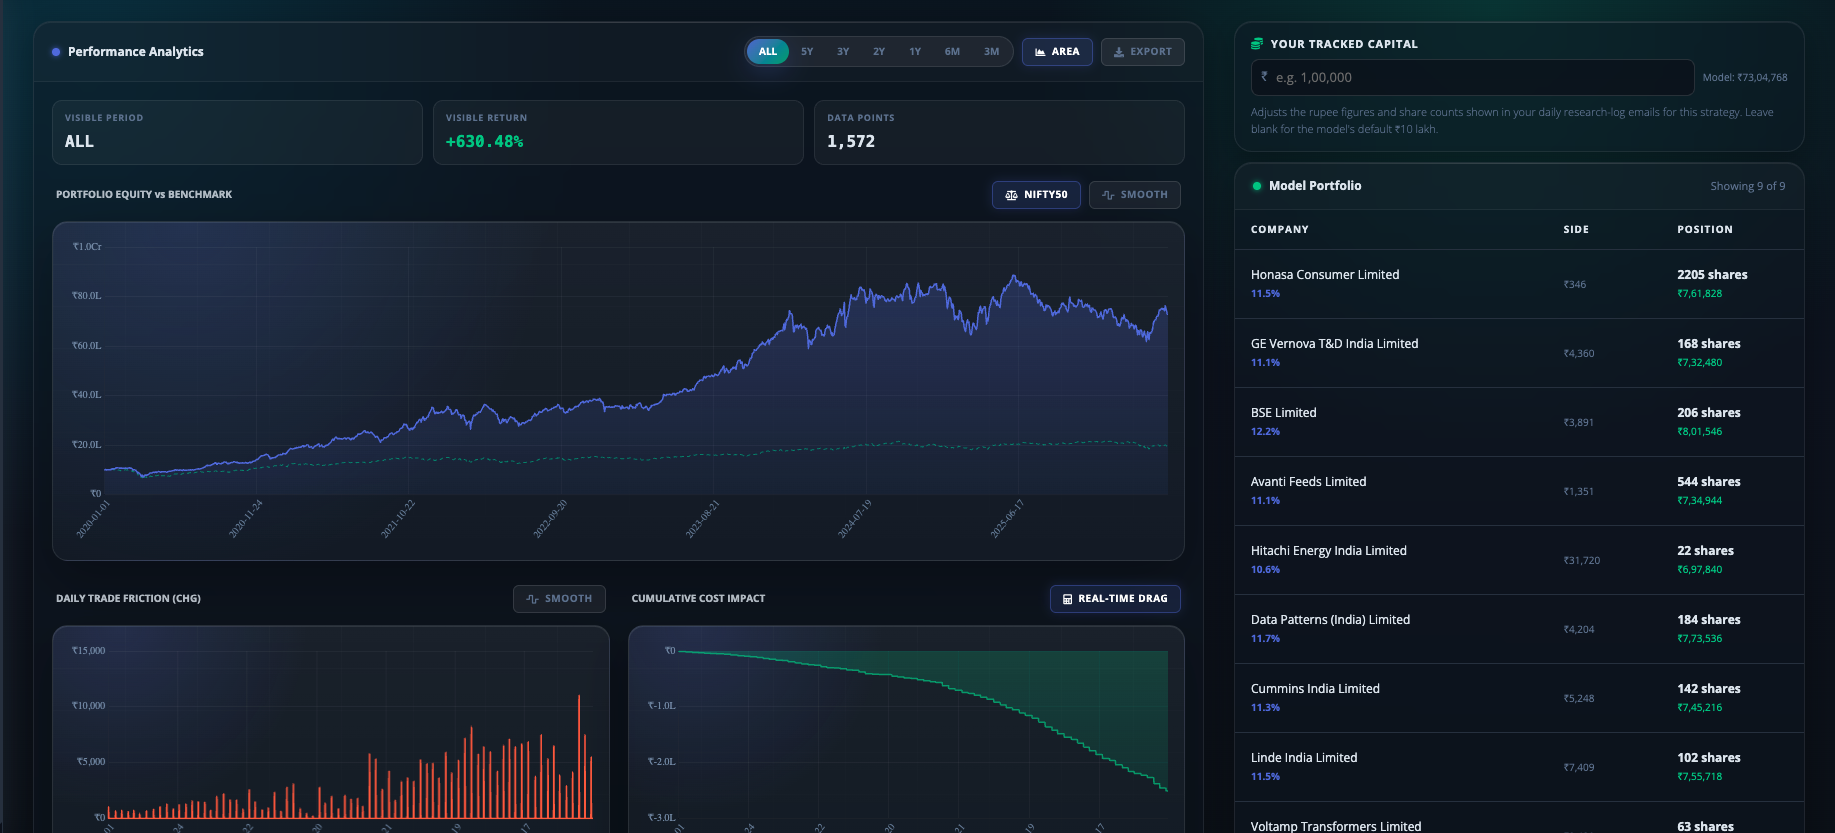
Analytics — equity, trades, costs, model portfolio
Full performance analytics: portfolio equity vs benchmark, daily trade profile, cumulative cost impact (so you see how much brokerage drag accumulates), plus the live Model Portfolio showing every open position with share count and entry side.
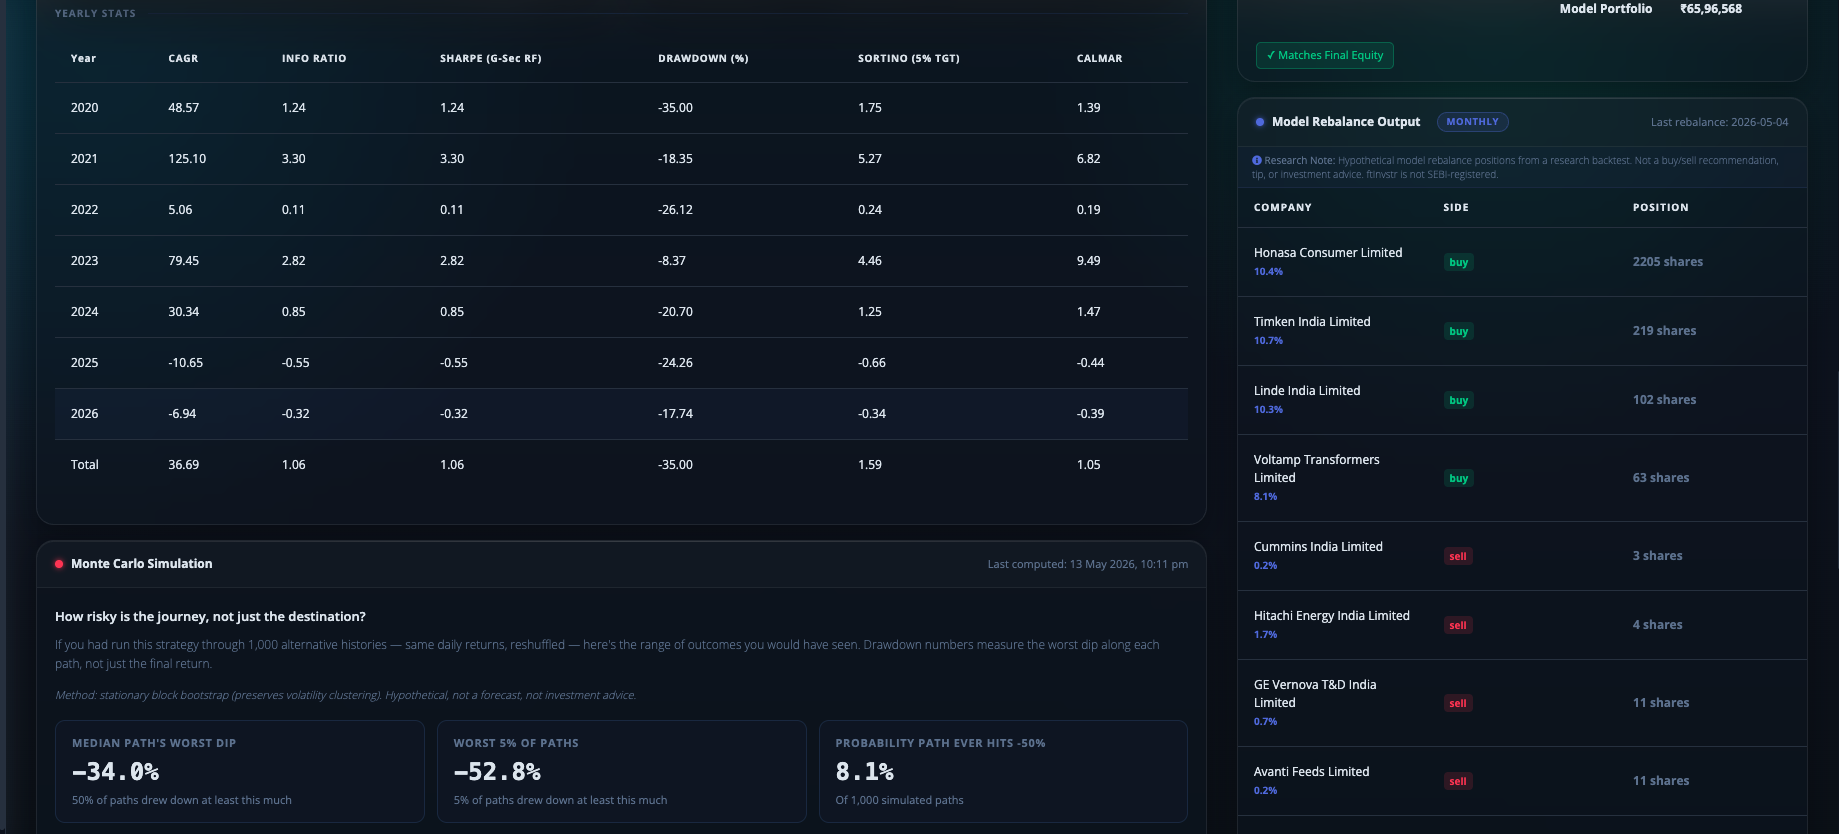
Year-by-Year breakdown & Monte Carlo
A calendar-year table of CAGR / Sharpe / Sortino / Drawdown / CAGR-vs-IBI / Calmar reveals if returns are concentrated in one period or spread across cycles. The Monte Carlo block answers "how risky is the journey?" by simulating thousands of alternate paths and showing the worst-case drawdown and probability of a positive end.
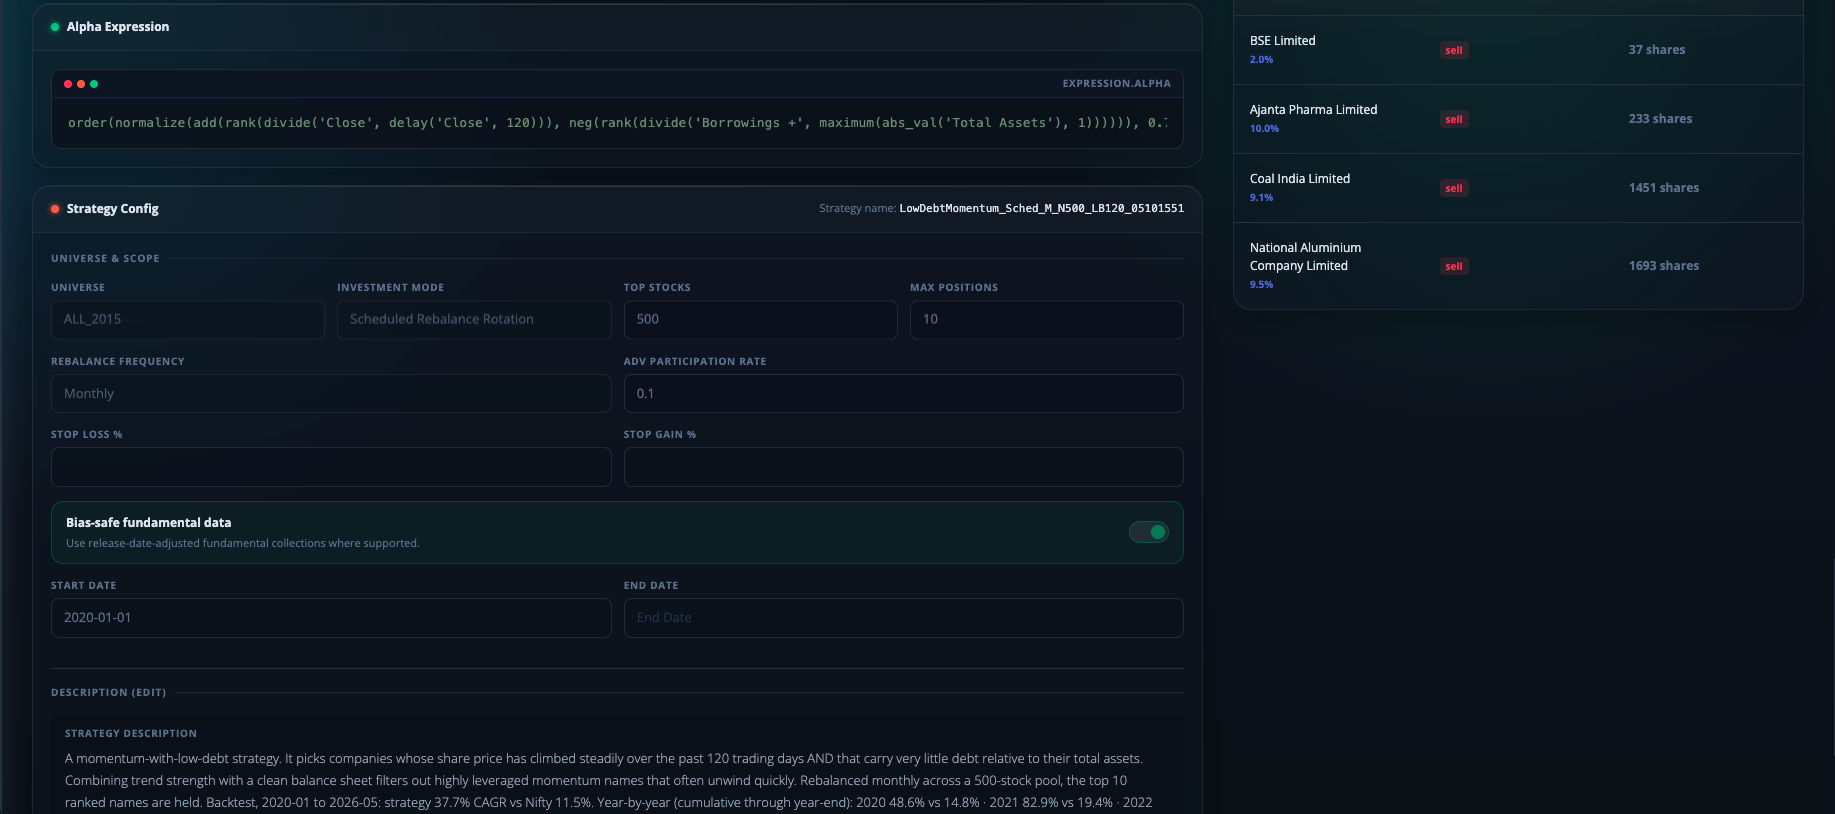
Alpha Expression & Strategy Config
At the bottom of every strategy page is full transparency: the exact Alpha Expression the backtest used, the Strategy Config (universe, top positions, rebalance frequency, brokerage, bias-safe toggle, date range), and a free-form description. No black box.
Daily Tracking
Strategies you save keep updating after market close
Strategy updates email
Once you save a strategy and toggle Track Capital, the engine re-evaluates the expression at every market close on the latest day's data and emails you the resulting rebalance output — which positions to hold, which to exit, which to enter. Live walk-forward research without you having to re-open the platform. Educational research only — not investment advice.
Ready to run your first backtest?
Create an account, pick a universe, write an expression, and get results in minutes.
Legal Disclaimer: ftInvstr is provided as a quantitative research and analytics tool for Indian equities. We are NOT SEBI-registered investment advisers or research analysts. All data, backtests, and strategy updates are for educational and informational purposes only and do not constitute financial advice or trade recommendations. Investing in the stock market involves risk; past performance is not a guarantee of future results.